What Is The Reports Manager And How To Use It?
The Reports Manager is located under the Reports section of the Shield Security Dashboard.
It provides a list of the all Alert and Info security reports for your site. here you can also create your own custom security reports.
You can jump into Shield on your WordPress site and create a brand new custom report, at any time.

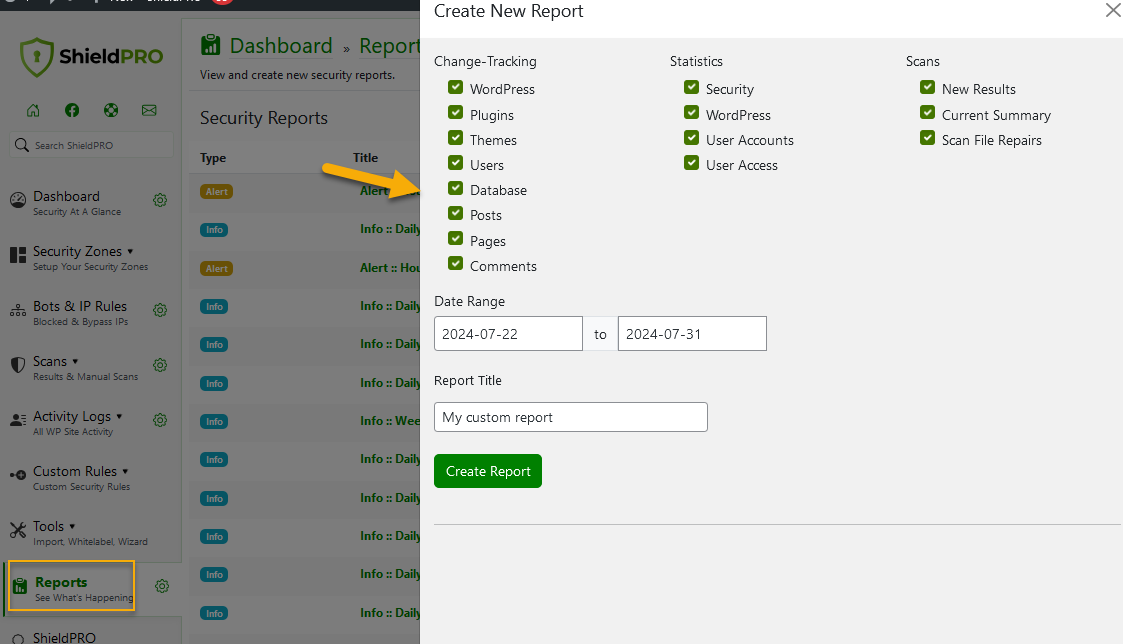
Particularly useful here is the incorporation of our Change Reporting feature so you can select any 2 dates to compare and have a report showing exactly what changed on your WordPress site.
Example Change Report

To learn more about the Change Report, read this blog article here.
To configure how often should you be sent important alerts and info reports, read this article here.
Note: ShieldPRO is required for the custom report option. To find out what the extra ShieldPRO features are and how to purchase, please follow this link here.