How to launch and use Debug Info Page
Debug Info Page helps you to get summary of the state of the Shield Security plugin and view various configuration information for your site.
It provides the following
- some of the most recent Shield events
- Shield summary, integrity and capabilities
- databases
- snapshots
- System information (PHP & MySQL and environment)
- WordPress general summary and plugins/themes information
- Service IPs summary
For example, if you want to know what your current PHP version is, you can easily find this information on your Debug Info Page.
How to launch Debug Info Page
You can launch it in 2 ways:
1) Through Configure section > General > "Enable Shield Security PRO Protection" option description.
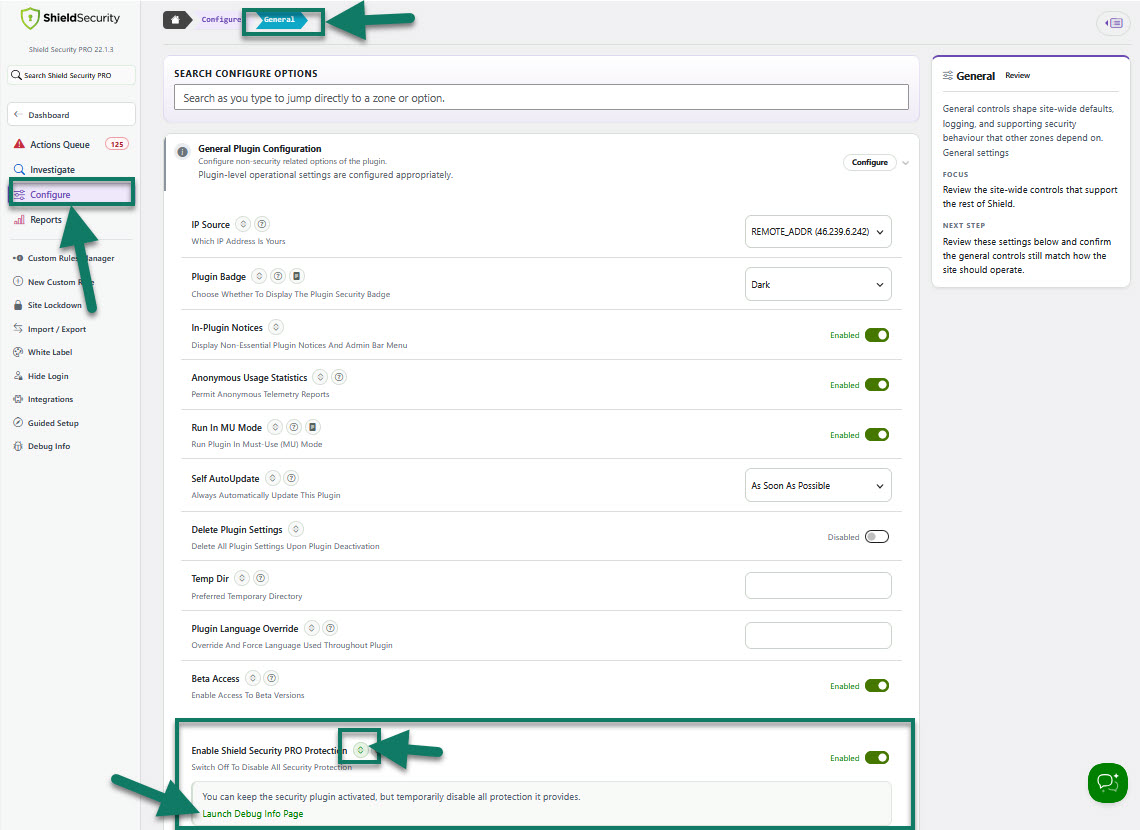
General: Access to Debug Info page
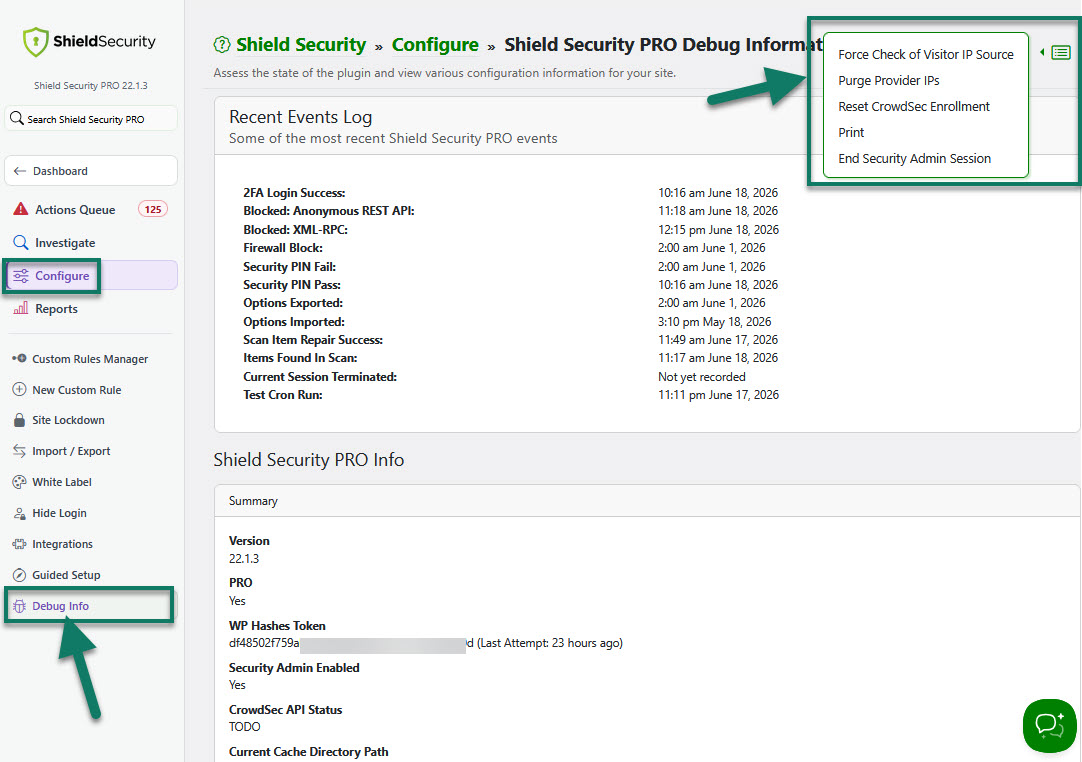
2) Under the main Configure section > Debug Info.
Here, under the Additional Actions drop-down menu in the top-right corner of the Debug Info page you can also
- force check of visitor IP source
- purge provider IPs
- reset CrowdSec enrollment
- print this page.
(see the screenshot below)