Review Your Site Traffic with the HTTP Request Log Viewer
HTTP Request Log Viewer is a great tool you can use to review all logs of HTTP requests made to your WordPress site, including live site traffic logs.
How to review your WordPress site traffic
To do this, simply enable configure Request Logging feature on the way you want.
Once you've done that, you may use the HTTP Request Log Viewer to get a more informed view on your site traffic.
HTTP Request Log Viewer provides a summary of each request including:
- time/date/day
- IP address (and User Agent)
- request path (including any query parameters)
- the HTTP response code for the request e.g. 200 (a successful request)
- whether the request was offense against the Shield Security plugin
It's located under the main Shield navigation menu > Investigate > HTTP Request log.
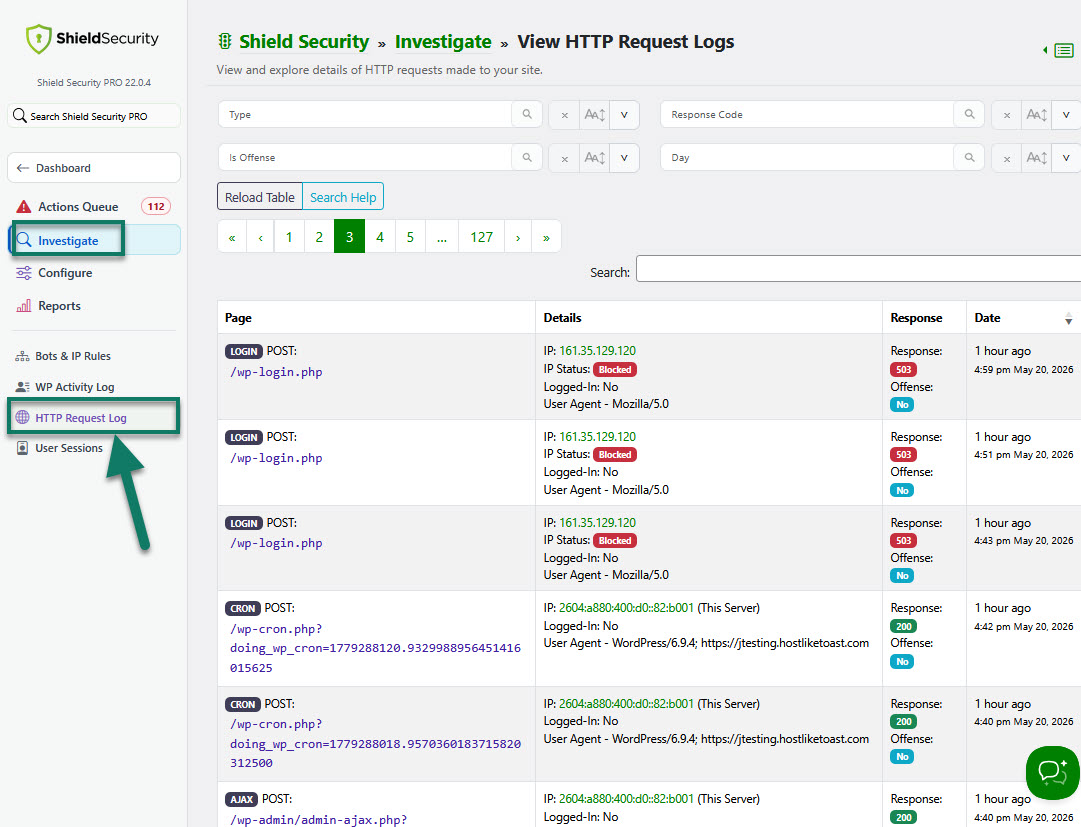
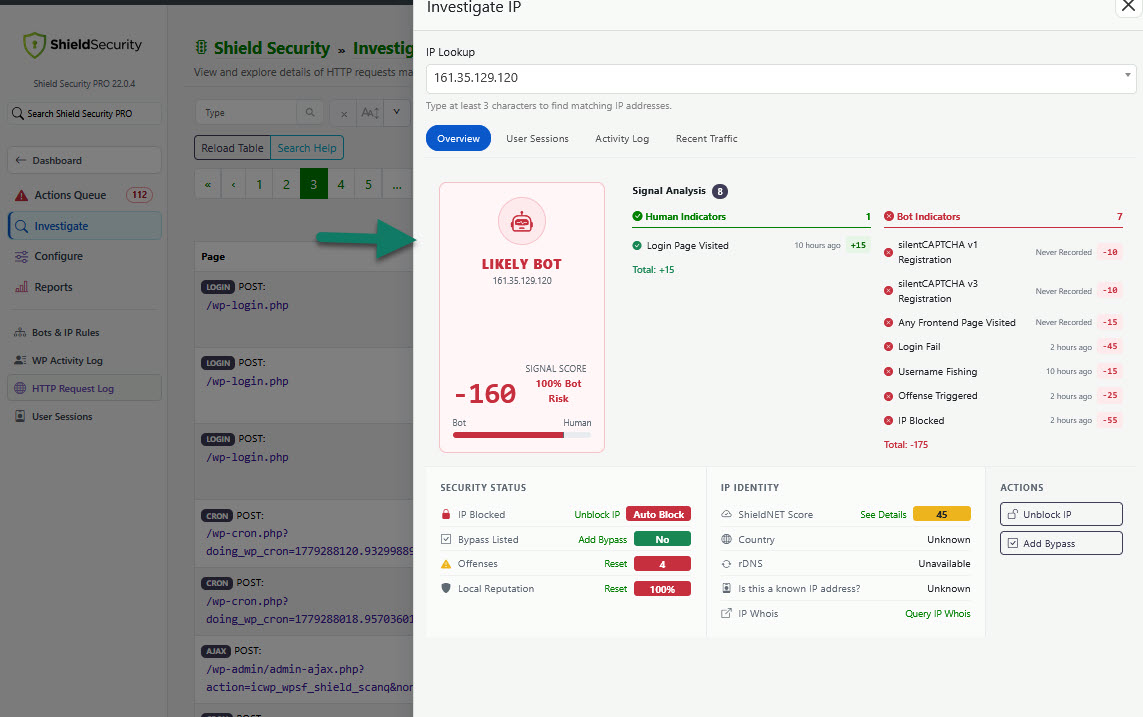
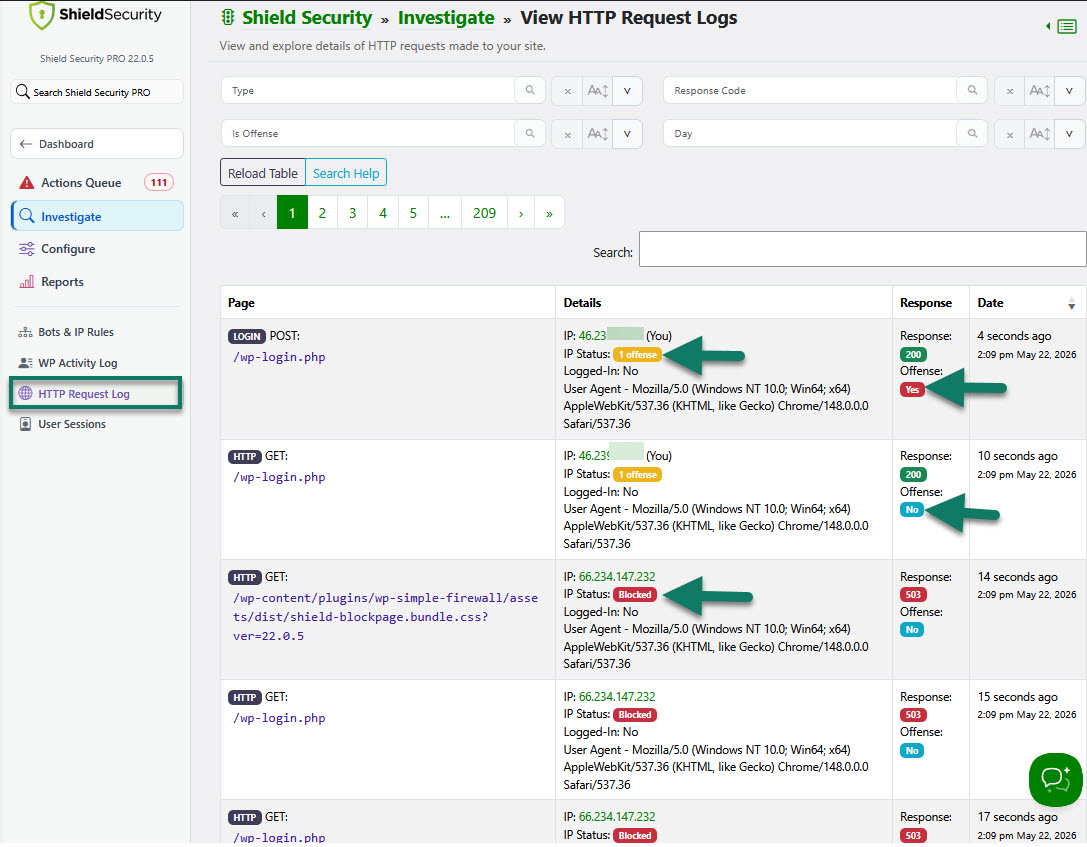
Note: If you click the particular IP address, you can further investigate that IP.
You can also filter display of entries in the log table from inside the HTTP Request Log Viewer and filter log entries by:
- Visitor IP address and status (if currently blocked or not)
- Username
- Request type
- Response status code
- Whether the request was offense or not
- Request day
- Use search box to search logs by certain keyword
You can also use the Ctrl button in the filters to select multiple logs.
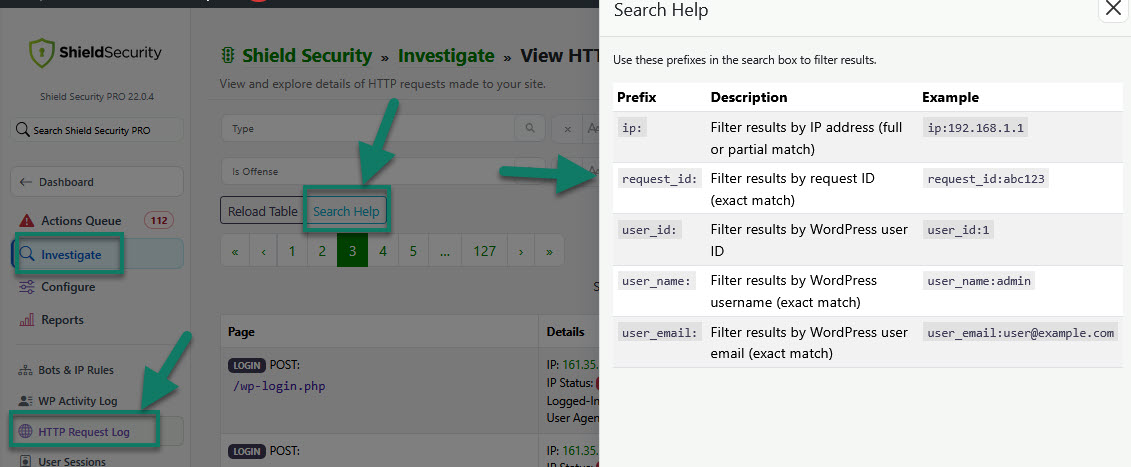
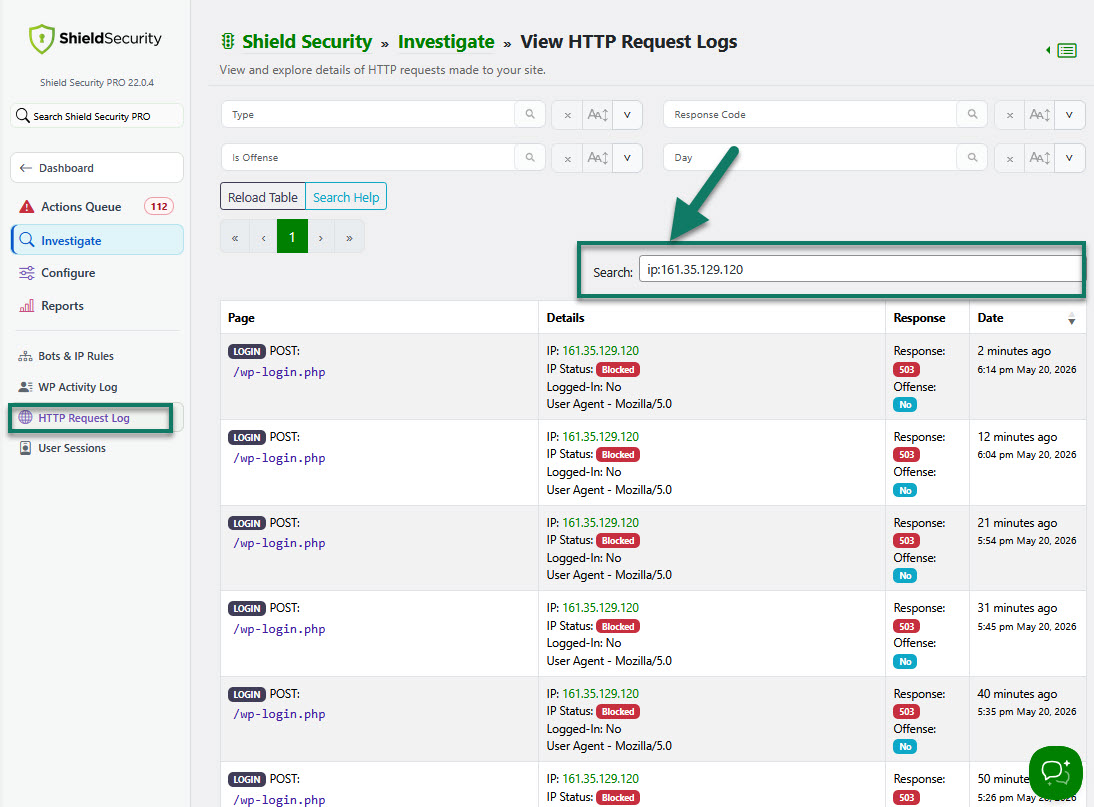
Advanced Logs Filtering
HTTP Request Log table (viewer) has a powerful search capabilities. You can
- Free-text search — search across all log entries naturally.
- Targeted filters — search by IP address, username, email, user ID, event description, and metadata values.
-
Search syntax help — a built-in help panel guides you through the available search options (for example ip: and user_id:) so you don’t have to memorise anything.
(see below screenshots)
Being able to quickly drill down to a specific IP address or user across thousands of log entries makes a real difference when you’re investigating an issue or responding to an incident.
GET and POST log entries example
It can sometimes happen that you see logs from the same IP address that appear identical, like the ones below.
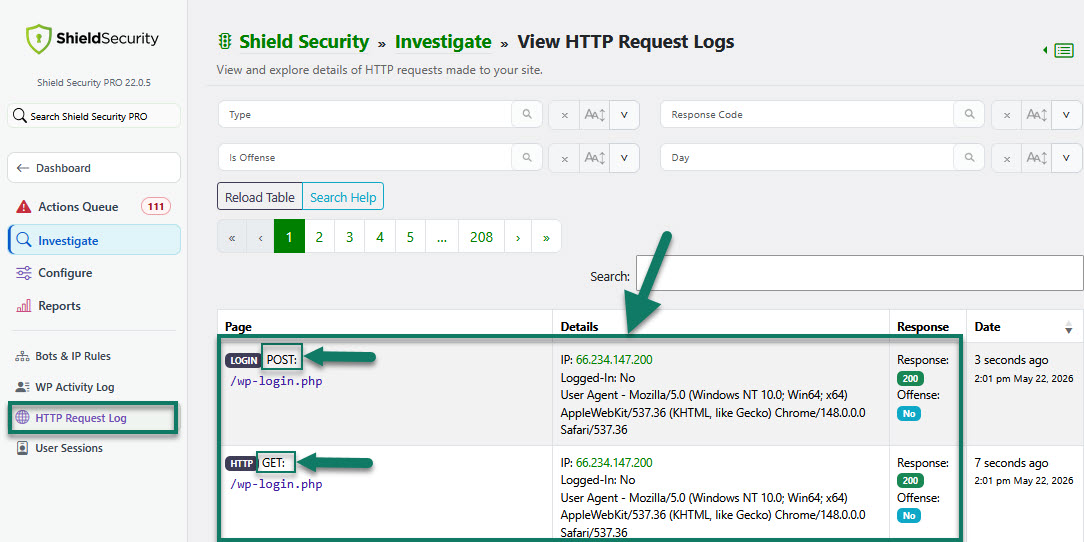
We're going to explain what this means.
-
Visitor has loaded the login page:
GET: "
/wp-login.php"" -
And then, the same visitor (IP) tried to login to this site:
POST: "
/wp-login.php" -
The response status code for this page is 200 (a successful request).
Note: The actual response depends on the request method used. In a POST request, the response contains an entity describing or containing the result of the action.
Status codes are best described in this article here.
These 2 entries seem identical. Why then the Viewer displays them both?
Even if these 2 entries seem identical, they're actually not. The difference is in GET and POST:
- GET: "/wp-login.php" - means that the visitor has loaded the login page only (not attempted to login).
- POST: "/wp-login.php" - means that the visitor has attempted to login (entered login details).
GET and POST are best explained in the second part of this article here.
Note: Under the "IP Status", HTTP Request Log Viewer also indicates whether it's an offense. and the number of offenses against plugin. Plus, if a visitor has exceeded the offense limit, their IP is immediate blocked from accessing your site. It will also show IP status "Blocked".
You can also switch to live traffic logs if you want.
There's an option to download your traffic logs if you need to.
For more information about the Request Logging feature, read the release article here.